With approximately 23 million bikes in a population of 17,5 million people, it is fair to say the Dutch are crazy about bikes. According to research from the Cycling Association, there are 850.000 road cyclists in the Netherlands. Heydays for cycling fans from the Netherlands! Not only did Jumbo Visma dominate the Vuelta resulting in a historical trilogy winning the Giro, Tour, and Vuelta, but the Netherlands is now hosting the European Road Championships 2023.
After hosting the Vuelta start last year, it was up to the province of Drenthe to show the beautiful, flat roads they had to offer. Flat? Yes. During the first 60 (females) and 110 (males) km, the only elevation cyclists encounter will be speed bumps. The 5/6 local laps of 13,5km afterward over Col du Vam end up totaling approx. 400m of elevation. On paper, a race for the sprinters you may think, but although the total elevation may not be enough to break away from the peloton, the ‘Col’ is actually brutal! Two sharp pinches with cobbled gradients up to 16%. Before we dive into the road races this weekend, the championships traditionally start with the individual time trial and team time trial.
Measuring for the perfect warm-up
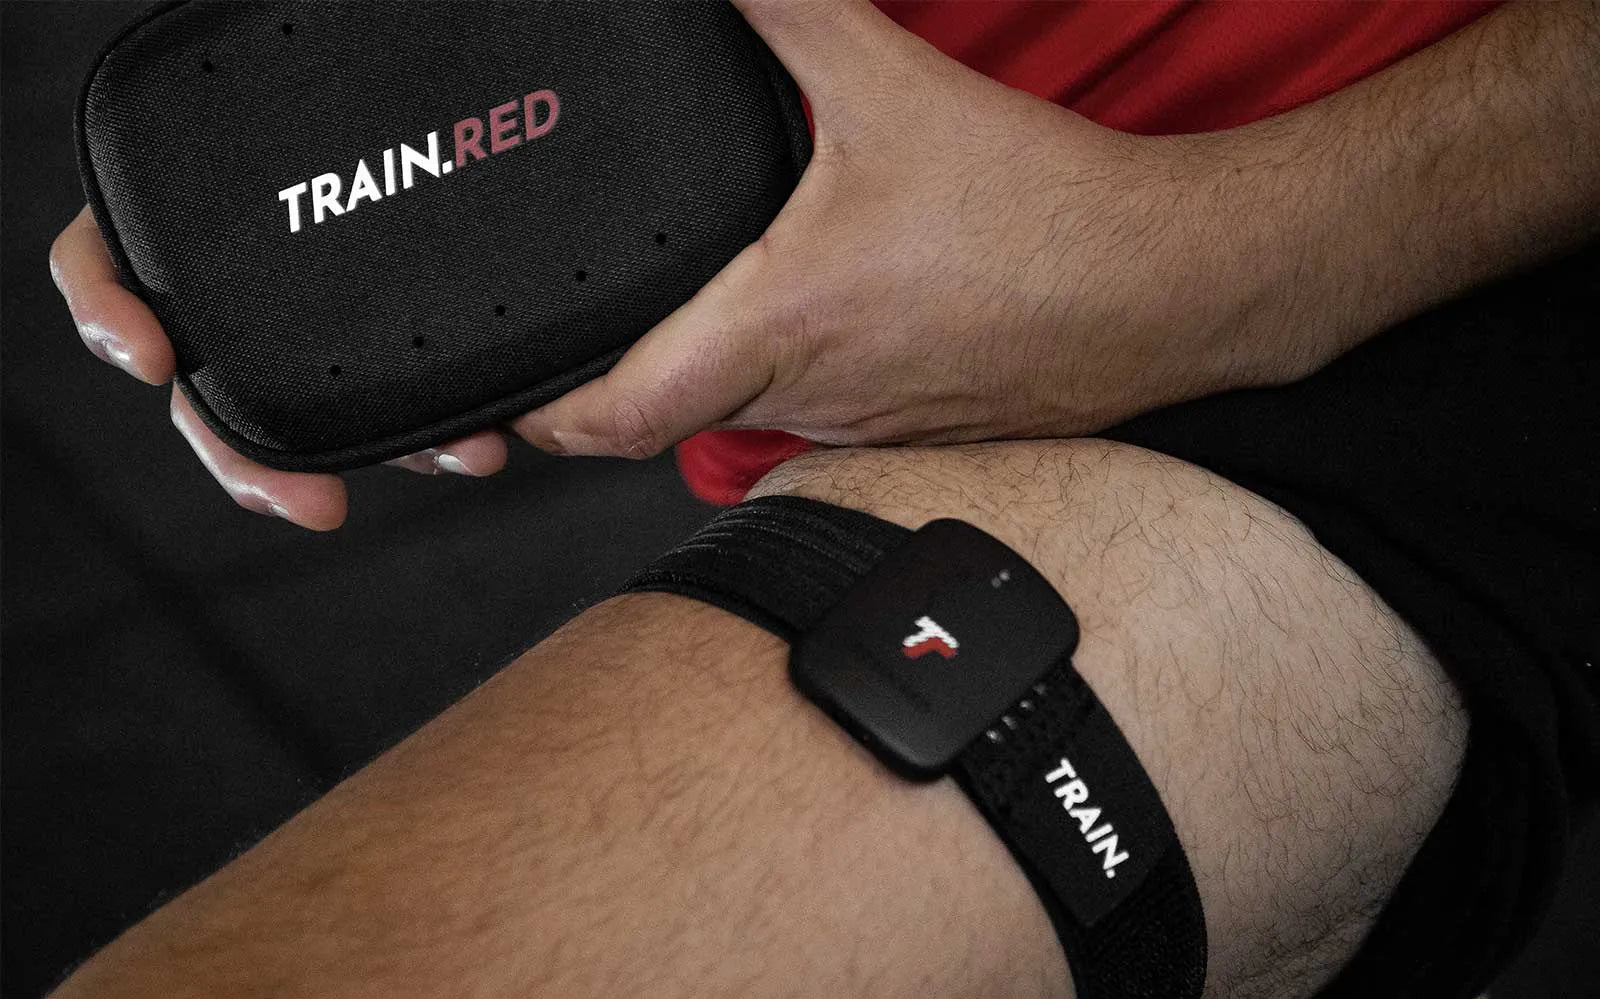
The 18-year-old Polish talent, Filip Gruszczyński is on the start list for all three of the events, the Individual Time Trial, Team Time Trial, and the Road race in the Youth category. Together with his Italian cycling team Energyteam ASD and coach Andrea Colombo, they have been using the Train.Red sensor during their tests and training sessions. Measuring thresholds, adjusting intensity, and optimizing the warm-up.
Adjusting the warm-up is specifically interesting during time trials. Right from the moment the gun goes, you want to give it all you’ve got. What better way to provide you with insight into his muscles than the actual warm-up for his European time trial performance?

The goal of the warming-up is to prepare the body for an optimal performance and prevent injuries. A proper warming-up results in an increased blood flow, allowing the muscle to receive more oxygen and dispose of the metabolic waste products in a more efficient way.
Muscle Oxygen and why
The Train.Red sensor measures the amount of oxygen in the muscle tissue, a proper warming-up results in increased oxygenation. The oxygenation that is provided by the Train.Red sensors is based on oxy and deoxy hemoglobin values. Interested in the theory behind these calculations? Read this section on NIRS technology!
If we sum the oxy and deoxy hemoglobin values, we measure the total hemoglobin concentration, this metric is closely correlated to blood flow.
If we align this with our envisioned, perfect warming-up, the total hemoglobin value should go up.
Over the course of the 2023 season, the team has been trialling several protocols. What works for the athlete, what works in terms of the physiological data, and maybe most importantly, which protocol yields the best results?
Equipped with 2 Train.Red FYER sensors, a heart rate strap and the Garmin Vector 3 power meter, Filip jumped on the Wahoo KICKR smart trainer for a nice and easy 10min spin. Occasionally dropping in the aero bars to feel the position, but mainly upright.
Real easy pedalling around 140W, increasing the heart rate from 100 BPM to 120 BPM, the biggest difference with most standardized Zwift workouts? Not ramping up the power. What users observe with the Train.Red sensors over and over again is the detrimental effect of a short ramped up warming-up. Even when limited in time, make sure to spin easily, before pushing hard.
Muscle Oxygen shown in the app below:

After the steady effort, it’s time to spike up the intensity. 3 bursts of 2 minutes with 2 minutes active recovery at 95% of race pace. Tough, but essential to get the body temperature up and the blood flowing.
Muscle Trend
A sneak peek of the new visualization of the Train.Red data below, muscle trend.
Blue, an upward trend, shows the supply of oxygen surpassing the demand for oxygen.
Yellow, a stable trend, a balance between supply and demand.
Red, a downward trend, shows the demand for oxygen surpassing the supply.

After the efforts it is very clear to see hyperaemia, the increase of blood flow to meet the metabolic needs of the upper leg muscle.
Total Hemoglobin
The trace that shows this hyperaemia even more pronounced, is the total hemoglobin level! Same section, 10min steady + 3 efforts, same leg, but a different variable.

Even more data for the data geeks
For the true data geeks, let’s have a look at the individual traces for oxy and deoxy hemoglobin. Similar to the muscle oxygen percentage, the oxyhemoglobin concentration increases during the 10’ steady effort. The heart starts pumping a bit faster and arteries dilate. When starting the first effort, it becomes clear why the oxygenation drops, the muscle uses the oxygen and we can see an increased deoxyhemoglobin concentration.

With the peak oxygen right after the last 2-minute interval, you might think this would be the time to start the time trial. This is not the case. The muscles produced metabolic waste which needs to be cleared out. Once the oxygenation and total hemoglobin concentration do not increase further, but stabilize, we’re ready for battle!
Another 7 minutes of easy cycling at +/-200 W before Filip headed to the start. In the graph below, we see the total hemoglobin concentration from the full warm-up.
10 minutes of easy pedalling, 3x2 min @95%, 7 minutes of easy pedalling.

Systematic increase up to the efforts, and afterward we see the values stabilize. The work from the team to develop and test the warm-up the past season paid off.
With an average speed of 48,5 km/h and 364 Watts Normalized, Filip came in 1 minute 40 down from the winner Albert Withen Philipsen. Averaging that power might not be for the everyday athlete, but how are you going to improve your warming-up?
Measure, adapt and improve! Would you like to get your own Muscle Oxygen System, check out ours here or book a FREE expert call to learn more.
*Photocredits banner image
hgrsmedia