How do you know, how fast you can go on the marathon?
How you do determine your running pace on race day?
In this blog, we will introduce how muscle oxygen data helped us in the preparation and during the Marathon in Rotterdam.
There are several ways to know, quantify or calculate the pace you can maintain for a long distance;
you can follow the instructions from your coach, you can run at a speed based on previous results, you can guide yourself with data or simply run by feel.
At Train.Red we’re big fans of data, but naturally, this should go hand in hand with your perceived effort and the recommendations of your coach. During the build-up towards your first, or one-hundredth marathon it is likely you will spend quite some extra time to reach the best possible time, in the most comfortable way. We recommend spending this extra time and attention to come best prepared and prevent injuries.
During these training sessions, you will develop a feel for speed. You will start to sense what pace you can run for an hour, and what a sprint tempo feels like. This feeling can be empowered and backed up by data.
At a very basic level, one of the first metrics you will use when you are consciously working towards an improved performance is time.
If you run the same loop as last week, and after 20 min you pass your local bakery, you can compare whether you’re faster than last week, or slower. Now how did this effort feel last week? Can you speed up, or should you be taking it down a notch? Of course, we need to consider the goal of this training session. Do you want to run your local loop as fast as possible or are we building our base condition?
A structured plan will help when aiming for a new personal best. This plan does most likely not consist solemnly of base workouts or all-out efforts on your local loop. To keep track of the intensity of the included threshold sessions, tempo efforts, interval sessions, or maybe even sprints, running just by feel and time is not going to cut it. We need another output metric that helps us with quantifying the intensity. This is where there are numerous options out there.
Muscle Oxygen?
This blog will explain how we used muscle oxygenation in preparation for running a marathon. Muscle oxygenation is one of the metrics you can use to determine the intensity of your training session but you can also use the data to determine your race pace!
There are two ways to know whether you are training and racing at the right intensity with muscle oxygenation.
- By performing an ‘incremental exercise test’ or a ‘ramp test’. Tests in which the speed or power is systematically increased until you cannot keep up anymore.
- By using the sensors during most of your training and truly getting to know your own body and the response from your muscle at a certain pace.
We will dive into these two methods but first, we're taking one step back. One of the easiest ways to describe the metric is to look at it as the balance between the supply and demand of oxygen in your muscle tissue.
- A stable trace means the activity is sustainable, your muscle uses an equal amount of oxygen as there is supplied by your cardiovascular system.
- A decreasing trend means the muscle consumes more oxygen than there is supplied, this is either limited by the cardiovascular system, which is not efficient enough in getting the oxygen to the tissue, or the ‘energy factories’ in your muscle tissue, the mitochondria, that are not able to extract the oxygen from the capillaries fast enough.
- an increasing trend simply means that the muscle is receiving more oxygen than what is consumed. A pattern you will see when you are adequately warming up or when recovering after an intense effort.
Exercise testing
During an incremental test, we will see a stable trace representing a sustainable effort until a threshold is reached from where the oxygenation starts to decrease. This is where your muscle needs more oxygen, but the supply can not keep up anymore. At the end of the test, when the activity is stopped, we can see a very pronounced resaturation, and the oxygen levels are spiking back up.
These thresholds can and have been linked to other respiratory thresholds and/or lactate thresholds in the past. There is no consensus in research yet on whether there is a clear correlation. Since it is a completely different metric this makes sense, but we measure related physiological markers, naturally, there is a relationship during these types of tests.
What is interesting for us in our search for a sustainable marathon pace, we can use the information from our muscles, even in real-time! The incremental exercise test can show us what power or speed outputs result in a maintainable balance between the supply and demand of oxygen.
Surpassing this threshold will result in desaturation, and when this balance is not restored, it will eventually end with the failure of the activity.

Muscle oxygenation during an incremental exercise test
The incremental exercise test is a test that continuously keeps on getting more difficult. The test starts at a given easy resistance and this resistance increases constantly until the athlete cannot go any further.
e.g. a cycling test starting at 100W and every second 0,5W is added. After a minute you will push 130W, after 2 min 160W, etc.
When starting this test without a warm-up, your muscle state will show a warming up/recovery state since the effort at the beginning is truly that easy. The middle of the test is getting more and more difficult, but the oxygenation in a working muscle group is still stable. There is a balance between the demand and supply of oxygen. The next state is where you will start to feel you’re working, the yellow state eventually ending up in the red state, a maximum effort. When the athlete has given their all and the test is stopped, we immediately see the response in the oxygen levels. A very clear reoxygenation and thus recovery.

Muscle oxygenation during a step test
This test is very similar to the incremental exercise test, but during this test, we are not continuously increasing the resistance, we take step increments. Instead of a ramp-up, there are blocks of a certain duration that get more difficult every time you reach the new block.
e.g. a cycling test starting at 100W, after 10 minutes we start the increments with a block of 30W for 3 minutes, when these 3 minutes went well, we add another 30W for 3 minutes, and this process is repeated until the athlete fails to finish a block or cannot start another block of 3 minutes.
The beginning of the test will be easy and maintainable, we’ll likely see a warming-up during the beginning followed by stable oxygenation. When the load is increased you’ll have to push a bit harder to cope with this new resistance. Your muscle responds with a purple load phase initially, but soon the balance between oxygen consumption and oxygen delivery will be restored. This results in a stable trace, but a bit lower in saturation than before. This continues throughout the test and depending on the protocol, duration, and moment of failure you will eventually, and with a red state slowly start to fade out and recover, or after a short ‘purple’ sprint ends up failing and recovering.
Train, Learn, Repeat
Besides these standardized tests, there are other ways to determine your race pace. Simply by doing a lot of training sessions and test events at different paces! A bit more work-intensive and they require a bit of experience with muscle oxygenation, but once understood they can be really helpful.
Let’s take a look at a relatively short and easy training session in preparation for the Rotterdam Marathon.
Training session - 2x4 km
The Train.Red FYER was connected via the SmO2 ANT+ profile of the Garmin Fenix 6 sports watch.
After a 10-minute warm-up jog, the watch was paused which naturally caused a gap in the data.
What we can see is that there is not a very pronounced increase in tissue saturation during this first 10 minutes, after a few stretches and strides however the blood flow and resulting muscle oxygenation increased since the efforts were started at a higher percentage of oxygen in the muscle tissue.
Today’s training menu is 2 times 4 kilometers at a marathon pace. Not a very long session, but getting comfortable with running at this speed. Adequate active rest in between to make sure we’re well and fully recovered before starting the second block.
Looking at the TSI/muscle oxygenation during the efforts, we see a non-linear curve flattening out roughly halfway through the effort and even slightly increasing near the end.

Ran on paved hilly streets and trails (Dutch reference… 116m elevation) so a bit of natural fluctuation in the trace but overall, it is the trend we’re interested in. The fact that there is no desaturation means there either is a balance between supply and demand, or the muscle is working fully anaerobic. When working fully anaerobic there will be no visible changes in the muscle oxygenation since there is no further utilization of oxygen.
In conclusion from today’s session, this pace seems sustainable, let’s try this over a longer period.
Half marathon race simulation
Learned from last training session’s mistakes; proper warming-up and not pausing the sports watch. After a slow jog for 15 minutes, a few tempo efforts, and some 200m repeats it was time to switch into race shoes.
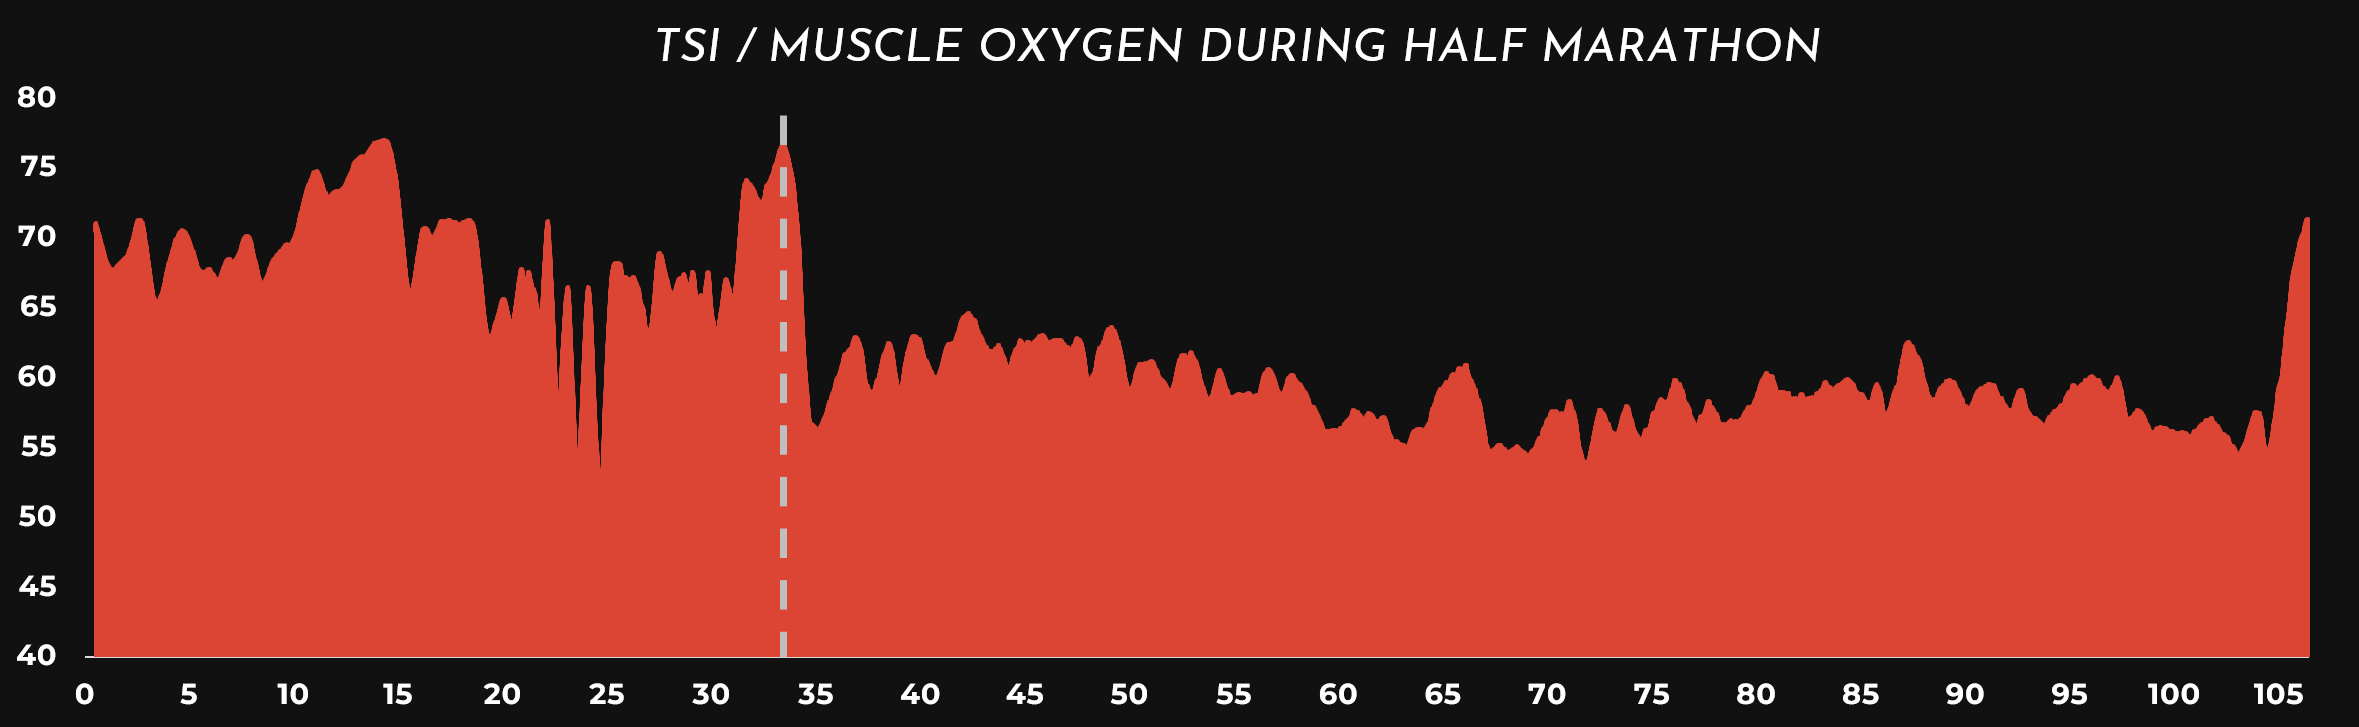
In retrospect, the rest in between the 200m repeats should have been a bit longer or easier. There is a clear desaturation and recovery at minute 25, but ideally, the muscle should reoxygenate further than the baseline level. Could have monitored this in real-time.
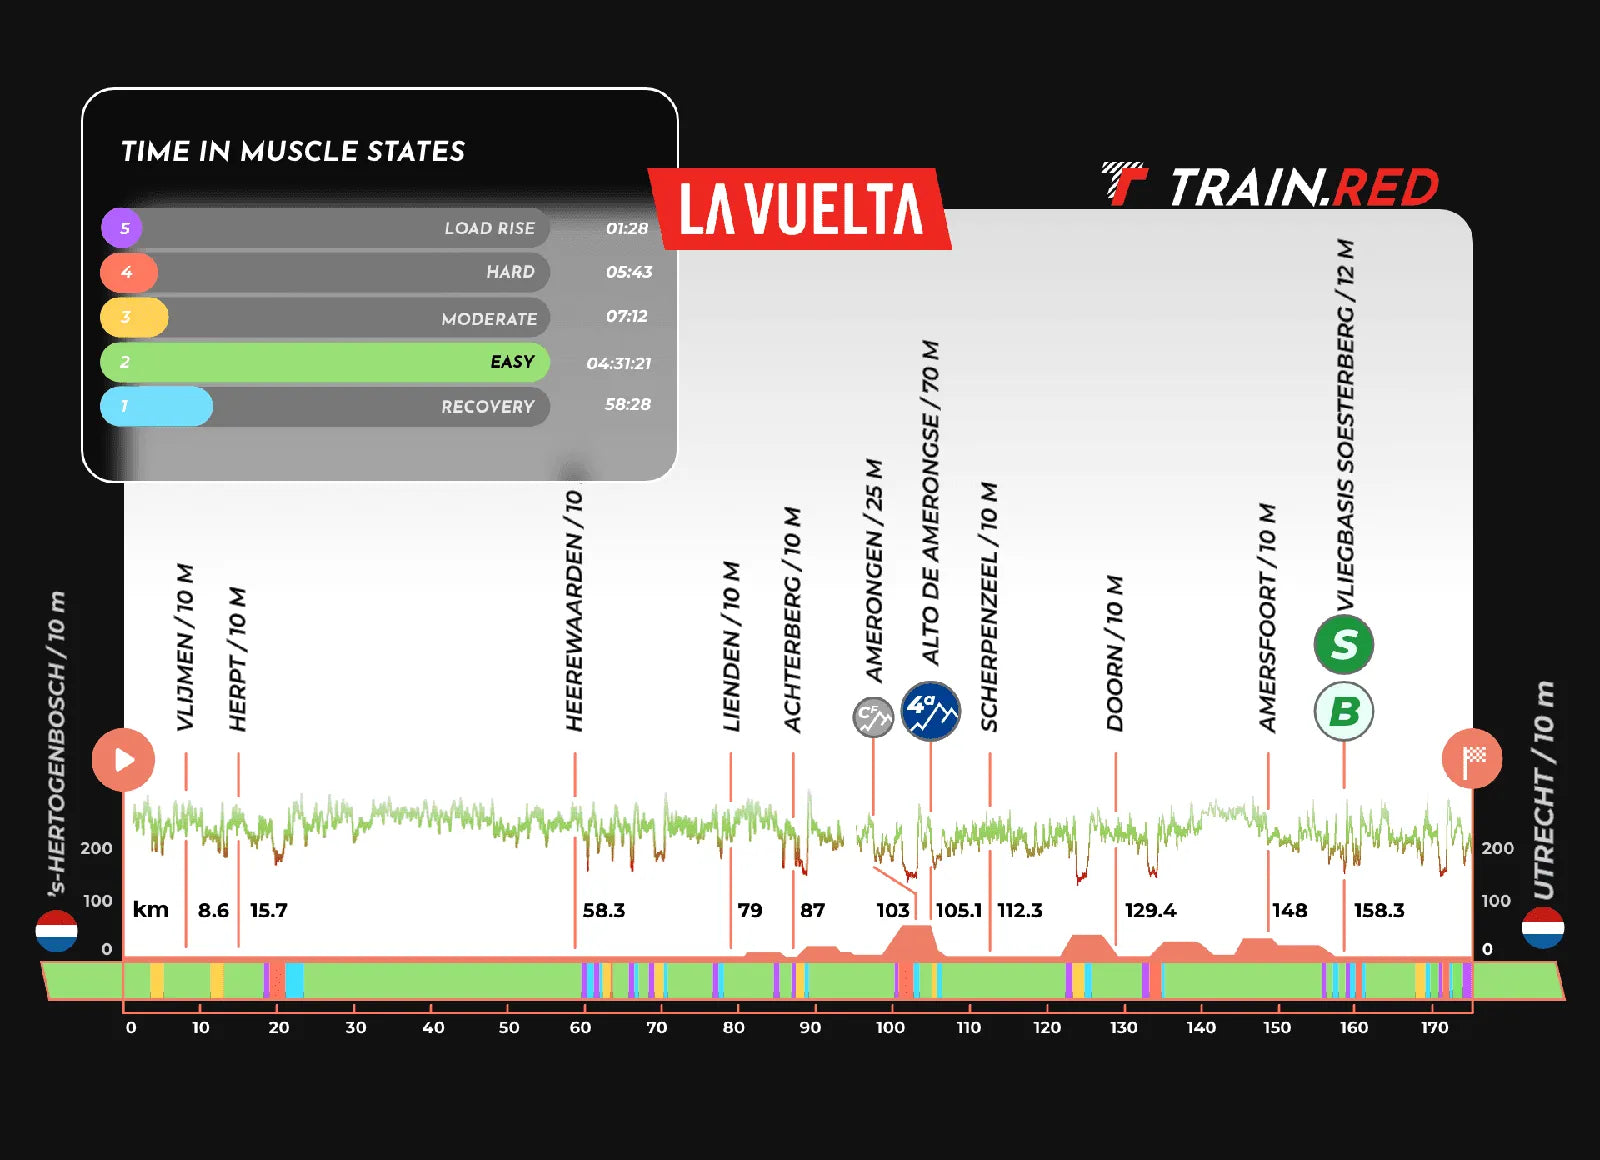
The effort itself is quite self-explanatory, if you as an athlete want to run a specific pace at a marathon, make sure you can maintain that pace for at least half the distance. Studying the trace, there is an interesting pattern, the oxygenation is not completely stable throughout the effort. There seems to be a sinusoidal wave pattern, more specifically, 2 parabolic curves. The fact that this effort consisted of two laps of approx. 10,5 kilometers could be the underlying cause.
Let’s visualize this data, with elevation included

Race day


Big personal best and with the current preparation close to the athlete’s full potential.
Including muscle oxygen data from NIRS measurement in your training routine, might seem complex but Train.Red devices focus on usability.
We’re constantly improving our key features and integrations to make real-time usage of the hardcore physiological data from your muscle usable for everyone.
As promised for our geeky readers, all data from the marathon Rotterdam:


header image source as well as registration for next year:
https://www.nnmarathonrotterdam.nl/